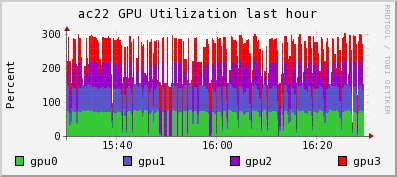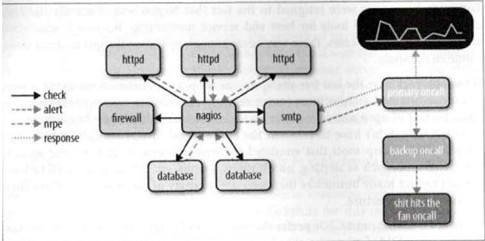
If you are running a cluster with NVIDIA GPUs, there now exists a python module for monitoring NVIDIA GPUs using the newly released Python bindings for NVML (NVIDIA Management Library). These bindings are under BSD license and allow simplified access to GPU metrics like temperature, memory usage, and utilization.
Graphite is an interesting project. If you wish to take a look at the project a bit deeper. The official Graphite Documentation is very comprehensive.
But some pointers could be useful.
Point 1: What is Graphite?
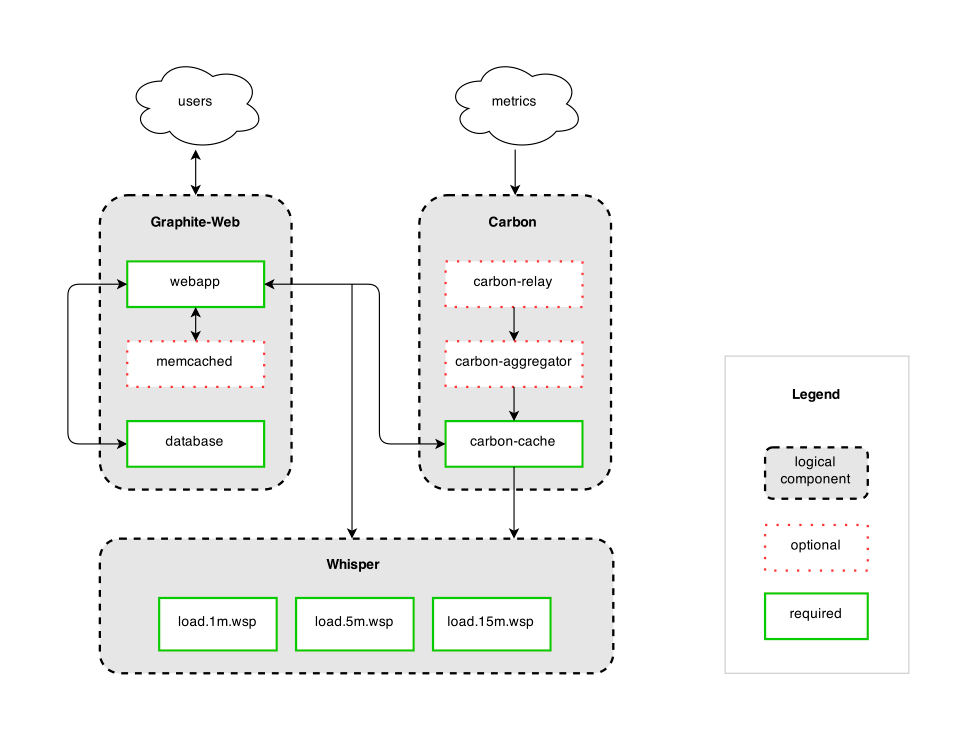
Graphite is a highly scalable real-time graphing system. As a user, you write an application that collects numeric time-series data that you are interested in graphing, and send it to Graphite’s processing backend, carbon, which stores the data in Graphite’s specialized database. The data can then be visualized through graphite’s web interfaces.
Graphite 1.2.0 Documentation
Point 2: Architecture
Graphite consists of 3 software components:
carbon – a Twisted daemon that listens for time-series data
whisper – a simple database library for storing time-series data (similar in design to RRD)
graphite webapp – A Django webapp that renders graphs on-demand using Cairo
Point 3: Who should be using Graphite?
Anybody who would want to track values of anything over time. If you have a number that could potentially change over time, and you might want to represent the value over time on a graph, then Graphite can probably meet your needs.
Specifically, Graphite is designed to handle numeric time-series data. For example, Graphite would be good at graphing stock prices because they are numbers that change over time. Whether it’s a few data points, or dozens of performance metrics from thousands of servers, then Graphite is for you. As a bonus, you don’t necessarily know the names of those things in advance (who wants to maintain such huge configuration?); you simply send a metric name, a timestamp, and a value, and Graphite takes care of the rest!
Graphite 1.2.0 Documentation
Point 4: Tools
Ganglia, a tool used by many High Performing Cluster (HPC) worldwide can be integrated with Graphite. Other tools that work with Graphite can be found here
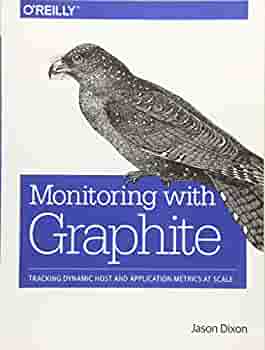
I read the book Monitoring with Graphite by Oreilly. Please read the book further. It is a good read. I’m just pending my own thoughts.
He mentioned something that is quite interesting that I have not really thought of. This can be divided into 3 main categories:
Fault Detection
Alerting
Capacity Planning
Fault Detection
Fault Detection is to identify when a resource becomes unavailable or starts to perform poorly. Traditionally, system administrators employ thresholds to recognise the delta in a system’s behaviour
Alerting
Alerting constitutes the moment the monitoring system identifies a fault, the recipient(s) is alerted through som means perhaps like email, SMS so that further actions can be taken by the recipient(s)
Capacity Planning
The act of capacity planning is the ability to study trends in the data and use that knowledge make informed decisions about adding capacity now or in the near future. You can use Graphite to work on the time-series data
Pull and Push Model
Pull Model – The Traditional Approach to IT Monitoring centers around a polling agent spending resources to connect to remote users or appliances to determine their current status. However, traditional method of pull method have limitation in integrating trending and monitoring and often different software stacks is required.
Push Model – Metrics are pushed from the sources to a unified storage repository, and providing with a consolidated set of data to drive both IT responses and business decisions. The advantage is that collection tasks are decentralised and we no longer require to scale our collection system horizontally as the architecture scale vertically. One of the interesting aspects of the push model is that we can isolate the functional responsibilities of the monitoring system.
Sometimes, you are a non-root user and you wish to change shell and you have an error
$ chsh -s /bin/tcsh
chsh you (user xxxxxxxxx) don't exist
This error occurs when the userID and Passowrd is using LDAP or Active Directory so there is no local account in the /etc/passwd where it first looks to. I used Centrify where we can configure the Default Shell Environment on AD. But there is a simple workaround if you do not want to bother your system administrator
First check that you have install tcsh. I have it!
Initialising a Repository in an Existing Directory
If you wish to have a project directory under version control with GIt, do the following
$ cd /home/user/my_project
$ git init
If you wish to add existing files into the version control
$ git add *.sh
$ git add LICENSE
$ git commit --m "Gekko Menu Help Application"
[master (root-commit) c98ae91] Gekko Menu Help Application
1 file changed, 73 insertions(+)
create mode 100755 mymenu.sh
You have an initial commit and tracked files. Hooray.
Checking the status of your Files
[user1@node1 menu]$ git status
# On branch master
nothing to commit, working directory clean
This means you have a clean working directory; in other words, none of your tracked files are modified.
Adding new files to your Git Directory
Let’s say you added a new file called check_license_abaqus.sh into the Project Directory, you will have something like
# On branch master
# Untracked files:
# (use "git add <file>..." to include in what will be committed)
#
# check_license_abaqus.sh
nothing added to commit but untracked files present (use "git add" to track)
To add files
[user1@node1 menu]$ git add check_license_abaqus.sh
[user1@node1 menu]$ git status
# On branch master
# Changes to be committed:
# (use "git reset HEAD <file>..." to unstage)
#
# new file: check_license_abaqus.sh
#
To remove file
[user1@node1 menu]$ git rm check_license_abaqus.sh -f
rm 'check_license_abaqus.sh'
[user1@node1 menu]$ git status
# On branch master
nothing to commit, working directory clean
To see log, you want to use the command
[user1@node1 menu]$ git log
commit xxxxxxxxx
Author: user1 <kmyemail_used_in_Github@hotmail.com>
Date: Sun Sep 25 23:50:33 2022 +0800
Gekko Menu Help Application
Preview support for upcoming Intel® processors, including the Intel® Data Center GPU Flex Series and Intel® Arc™ GPU
Support for 4th Gen Intel® Xeon Scalable processor (code named Sapphire Rapids)
Reduced memory consumption when using dynamic shapes on CPU to improve efficiency of NLP applications
Portability and Performance
Introducing new performance hint “Cumulative throughput” in AUTO device plug-in, enabling multiple accelerators (e.g. multiple GPUs) to be used at once maximizing inferencing performance.
GitHub is the largest code-hosting platform in the world. It uses Git as version control and the repository is based on GitHub. Features such as Pull Requests, Project Boards and GitHub are central and found in one place.
On Linux, you can generate your SSH key using the email that you have created in your GitHub User Account
[user1@node1 ~]$ ssh-keygen -t rsa -C "myemail_used_in_Github@hotmail.com"
Generating public/private rsa key pair.
Enter file in which to save the key (/home/user1/.ssh/id_rsa):
/home/user1/.ssh/id_rsa already exists.
Overwrite (y/n)? y
Enter passphrase (empty for no passphrase):
Enter same passphrase again:
Your identification has been saved in /home/user1/.ssh/id_rsa.
Your public key has been saved in /home/user1/.ssh/id_rsa.pub.
The key fingerprint is:
........
........
Adding the SSH Key to the ssh-agent
Although this is not mandatory, adding the SSH Key to the SSH Agent is a good practice that will keep the SSH Key safe. The SSH-agent is an SSH Key Manager that helps to keep the SSH key safe because it protects your SSH keys from being exported. The SSH Agent also saves you from having to type the passphrase you create. every time your SSH key is used.
Before you check, you want to check your ~/.ssh/config first
$ vim ~/.ssh/config
Host *
AddKeysToAgent yes
At the Terminal,
$ ssh-add ~/.ssh/id_rsa
Copy your SSH Public Key to the field. In your ~/.ssh/config, it should have a .pub extension like id_rsa.pub
Configuring Git
To intialise the Git. Do the following. You may want to take a look at
Ethtool is a utility for configuration of Network Interface Cards (NICs). This utility allows querying and changing settings such as speed, port, auto-negotiation, PCI locations and checksum offload on many network devices, especially Ethernet devices.
1. Query the specified network device for associated driver information