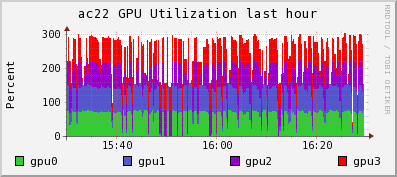
If you are running a cluster with NVIDIA GPUs, there now exists a python module for monitoring NVIDIA GPUs using the newly released Python bindings for NVML (NVIDIA Management Library). These bindings are under BSD license and allow simplified access to GPU metrics like temperature, memory usage, and utilization.
Graphite is an interesting project. If you wish to take a look at the project a bit deeper. The official Graphite Documentation is very comprehensive.
But some pointers could be useful.
Point 1: What is Graphite?
Graphite is a highly scalable real-time graphing system. As a user, you write an application that collects numeric time-series data that you are interested in graphing, and send it to Graphite’s processing backend, carbon, which stores the data in Graphite’s specialized database. The data can then be visualized through graphite’s web interfaces.
Graphite 1.2.0 Documentation
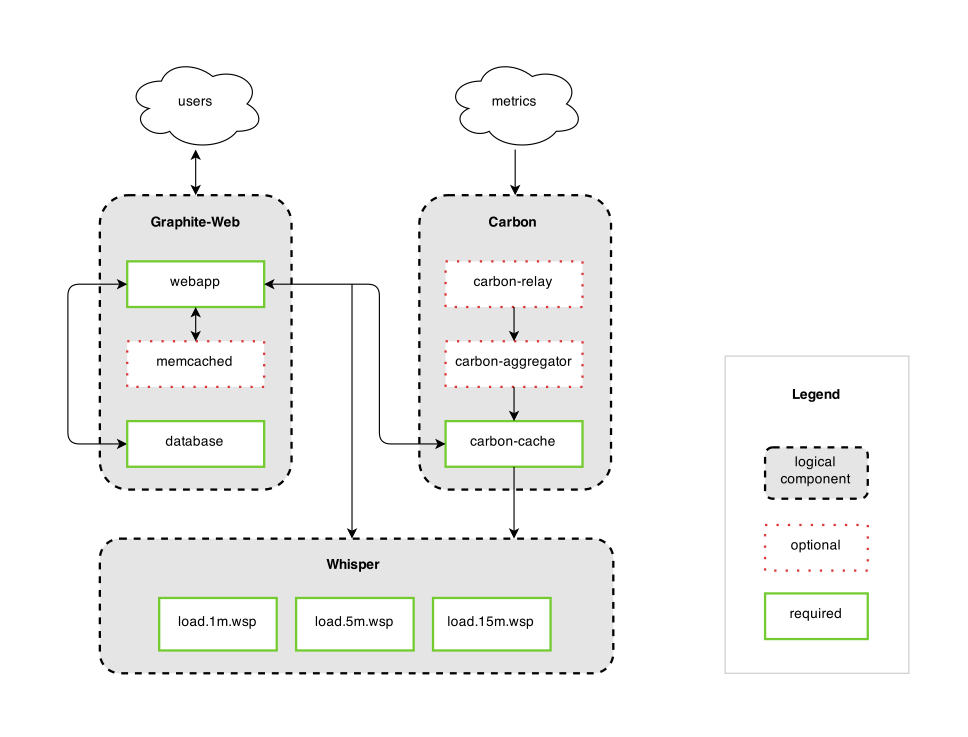
Point 2: Architecture
Graphite consists of 3 software components:
carbon – a Twisted daemon that listens for time-series data
whisper – a simple database library for storing time-series data (similar in design to RRD)
graphite webapp – A Django webapp that renders graphs on-demand using Cairo
Point 3: Who should be using Graphite?
Anybody who would want to track values of anything over time. If you have a number that could potentially change over time, and you might want to represent the value over time on a graph, then Graphite can probably meet your needs.
Specifically, Graphite is designed to handle numeric time-series data. For example, Graphite would be good at graphing stock prices because they are numbers that change over time. Whether it’s a few data points, or dozens of performance metrics from thousands of servers, then Graphite is for you. As a bonus, you don’t necessarily know the names of those things in advance (who wants to maintain such huge configuration?); you simply send a metric name, a timestamp, and a value, and Graphite takes care of the rest!
Graphite 1.2.0 Documentation
Point 4: Tools
Ganglia, a tool used by many High Performing Cluster (HPC) worldwide can be integrated with Graphite. Other tools that work with Graphite can be found here
I read the book Monitoring with Graphite by Oreilly. Please read the book further. It is a good read. I’m just pending my own thoughts.
He mentioned something that is quite interesting that I have not really thought of. This can be divided into 3 main categories:
Fault Detection
Alerting
Capacity Planning
Fault Detection
Fault Detection is to identify when a resource becomes unavailable or starts to perform poorly. Traditionally, system administrators employ thresholds to recognise the delta in a system’s behaviour
Alerting
Alerting constitutes the moment the monitoring system identifies a fault, the recipient(s) is alerted through som means perhaps like email, SMS so that further actions can be taken by the recipient(s)
Capacity Planning
The act of capacity planning is the ability to study trends in the data and use that knowledge make informed decisions about adding capacity now or in the near future. You can use Graphite to work on the time-series data
Pull and Push Model
Pull Model – The Traditional Approach to IT Monitoring centers around a polling agent spending resources to connect to remote users or appliances to determine their current status. However, traditional method of pull method have limitation in integrating trending and monitoring and often different software stacks is required.
Push Model – Metrics are pushed from the sources to a unified storage repository, and providing with a consolidated set of data to drive both IT responses and business decisions. The advantage is that collection tasks are decentralised and we no longer require to scale our collection system horizontally as the architecture scale vertically. One of the interesting aspects of the push model is that we can isolate the functional responsibilities of the monitoring system.