The Article is taken from On-Prem No Longer Centre Stage for Broader HPC Storage
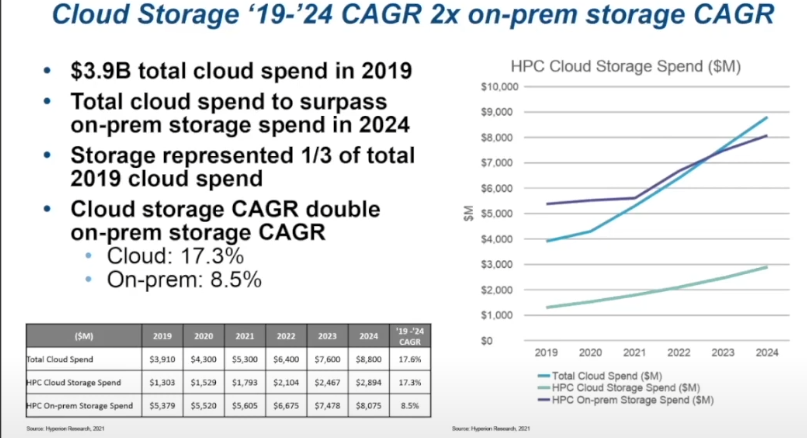
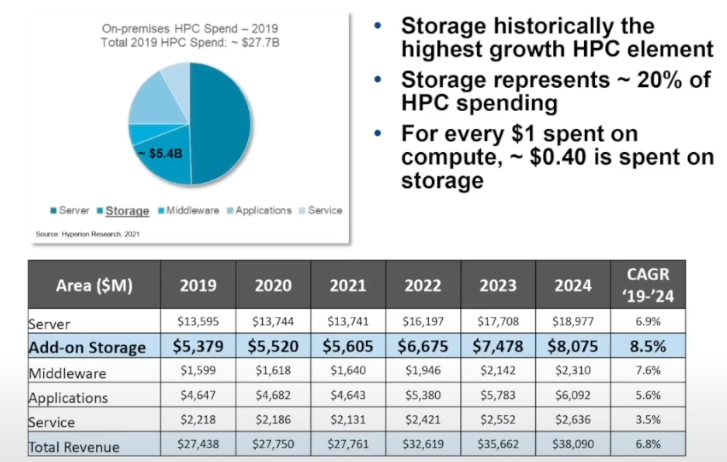
AI/ML, more sophisticated analytics, and larger-scale HPC problems all bode well for the on-prem storage market in high performance computing (HPC) and are an even bigger boon for cloud storage vendors.
Nossokoff points to several shifts in the storage industry and among the top supercomputing sites, particularly in the U.S. that reflect changing priorities with storage technologies, especially with the mixed file problems AI/ML introduce into the traditional HPC storage hierarchy. “We’re seeing a focus on raw sequential large block performance in terms of TB/s, high-throughput metadata and random small-block IOPS performance, cost-effective capacity for increasingly large datasets in all HPC workloads, and work to add intelligent placement of data so it’s where it needs to be.”
In addition to keeping pace with the storage tweaks to suit AI/ML as well as traditional HPC, there have been shifts in the vendor ecosystem this year as well. These will likely have an impact on what some of the largest HPC sites do over the coming years as they build and deploy their first exascale machines. Persistent memory is becoming more common, companies like Samsung are moving from NVMe to CXL, which is an indication of where that might fit in the future HPC storage and memory stack. Companies like Vast Data, which were once seen as an up and coming player in the on-prem storage hardware space for HPC transformed into a software company, Nossokoff says.
On-Prem No Longer Centre Stage for Broader HPC Storage – NextPlatform